1
2
3
4
5
6
7
8
9
10
11
12
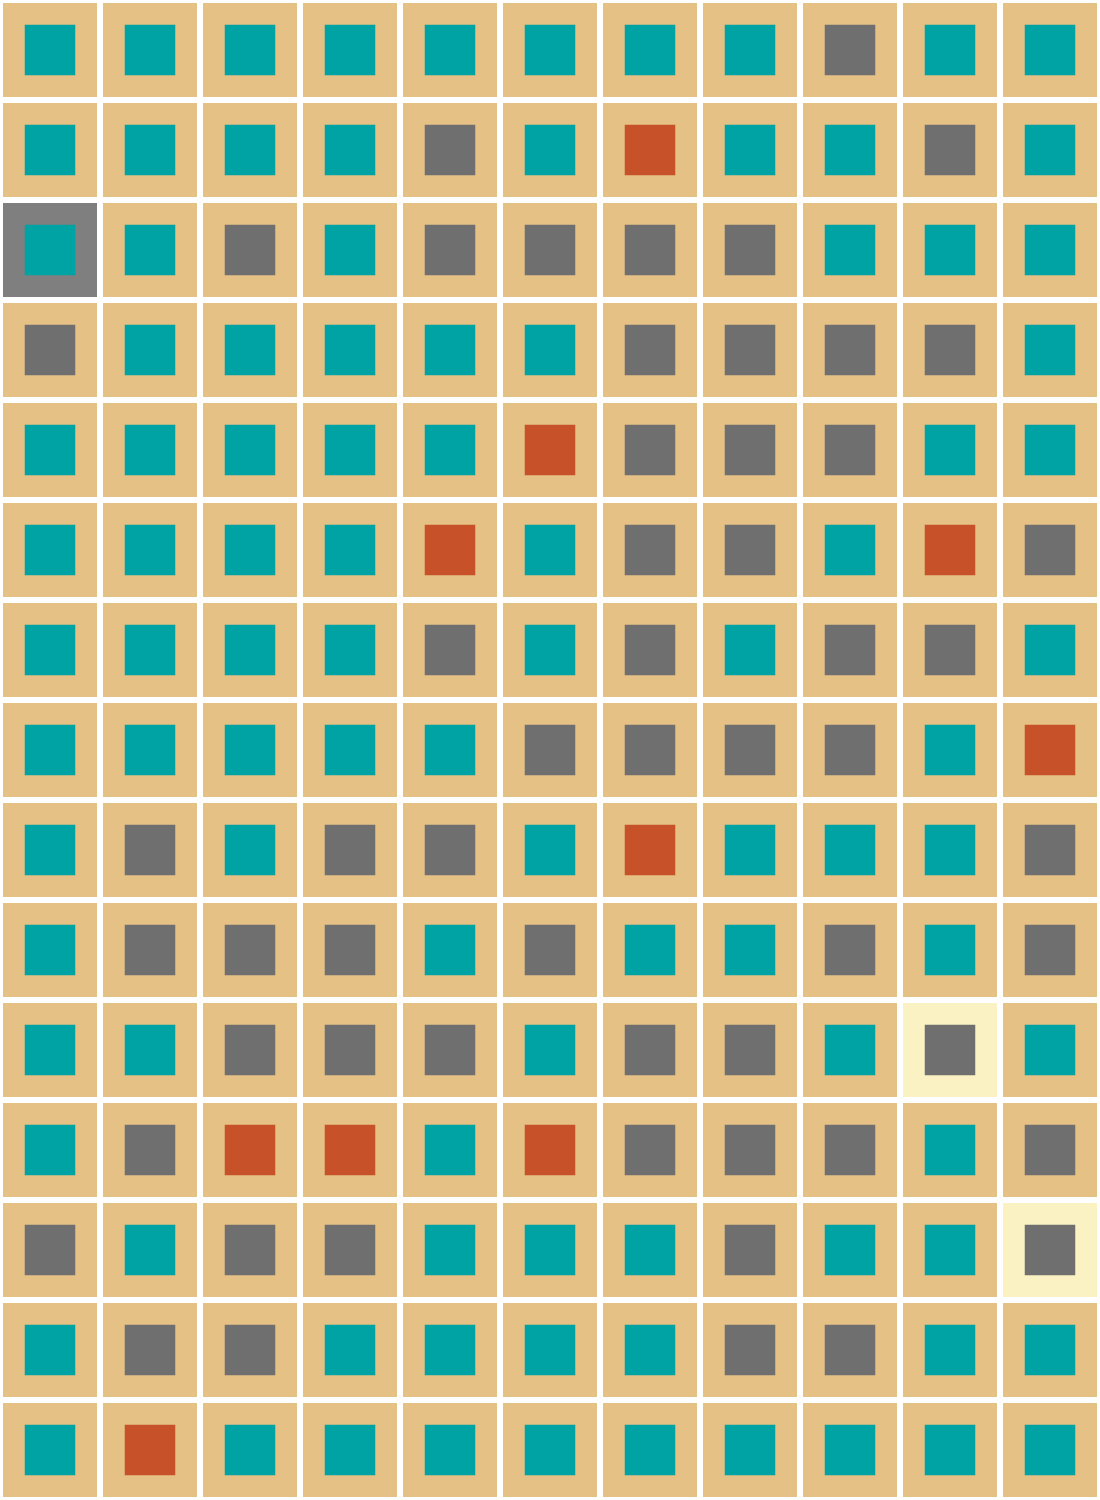
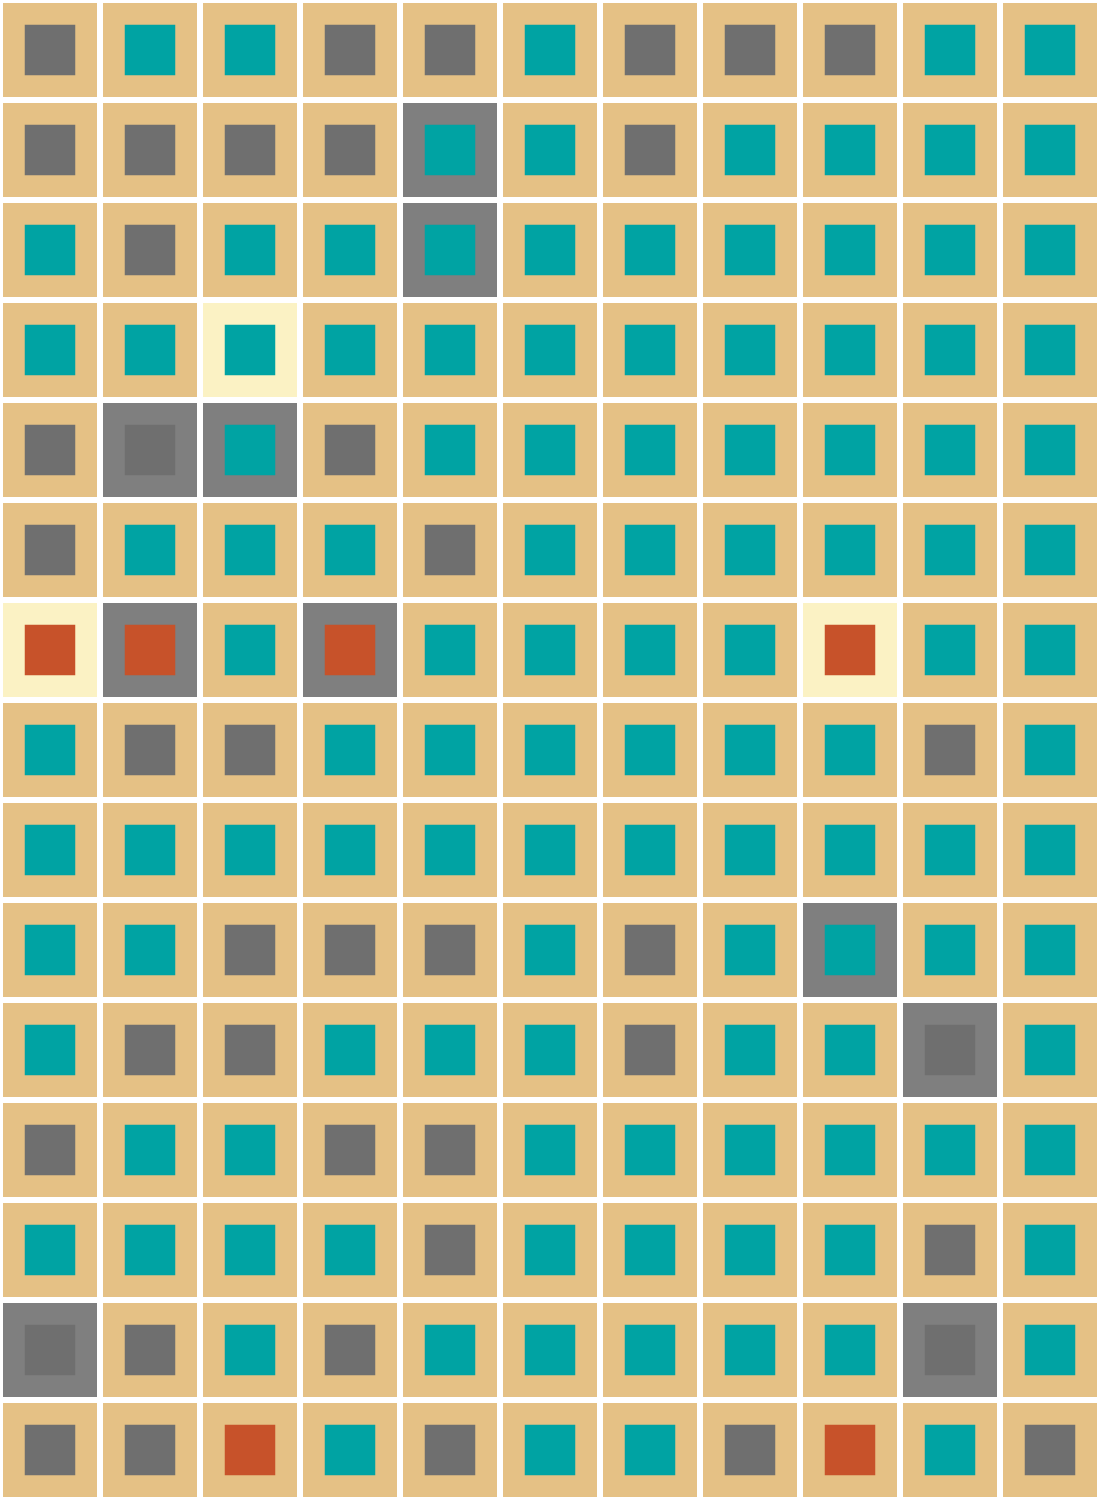
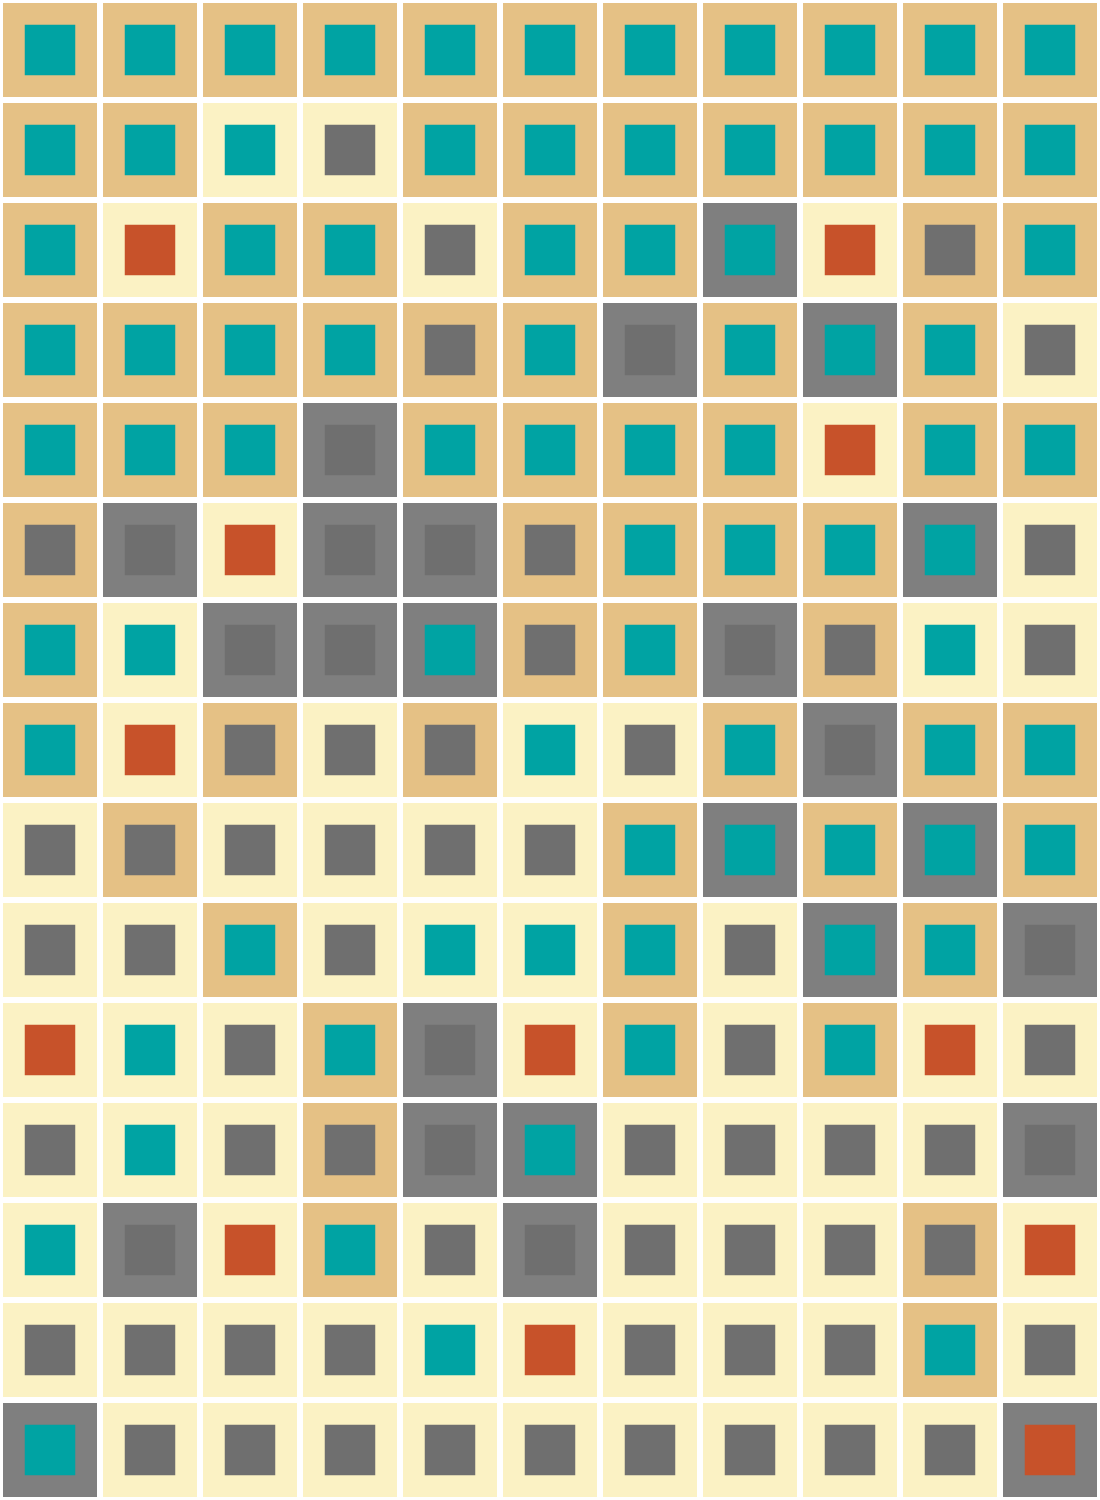
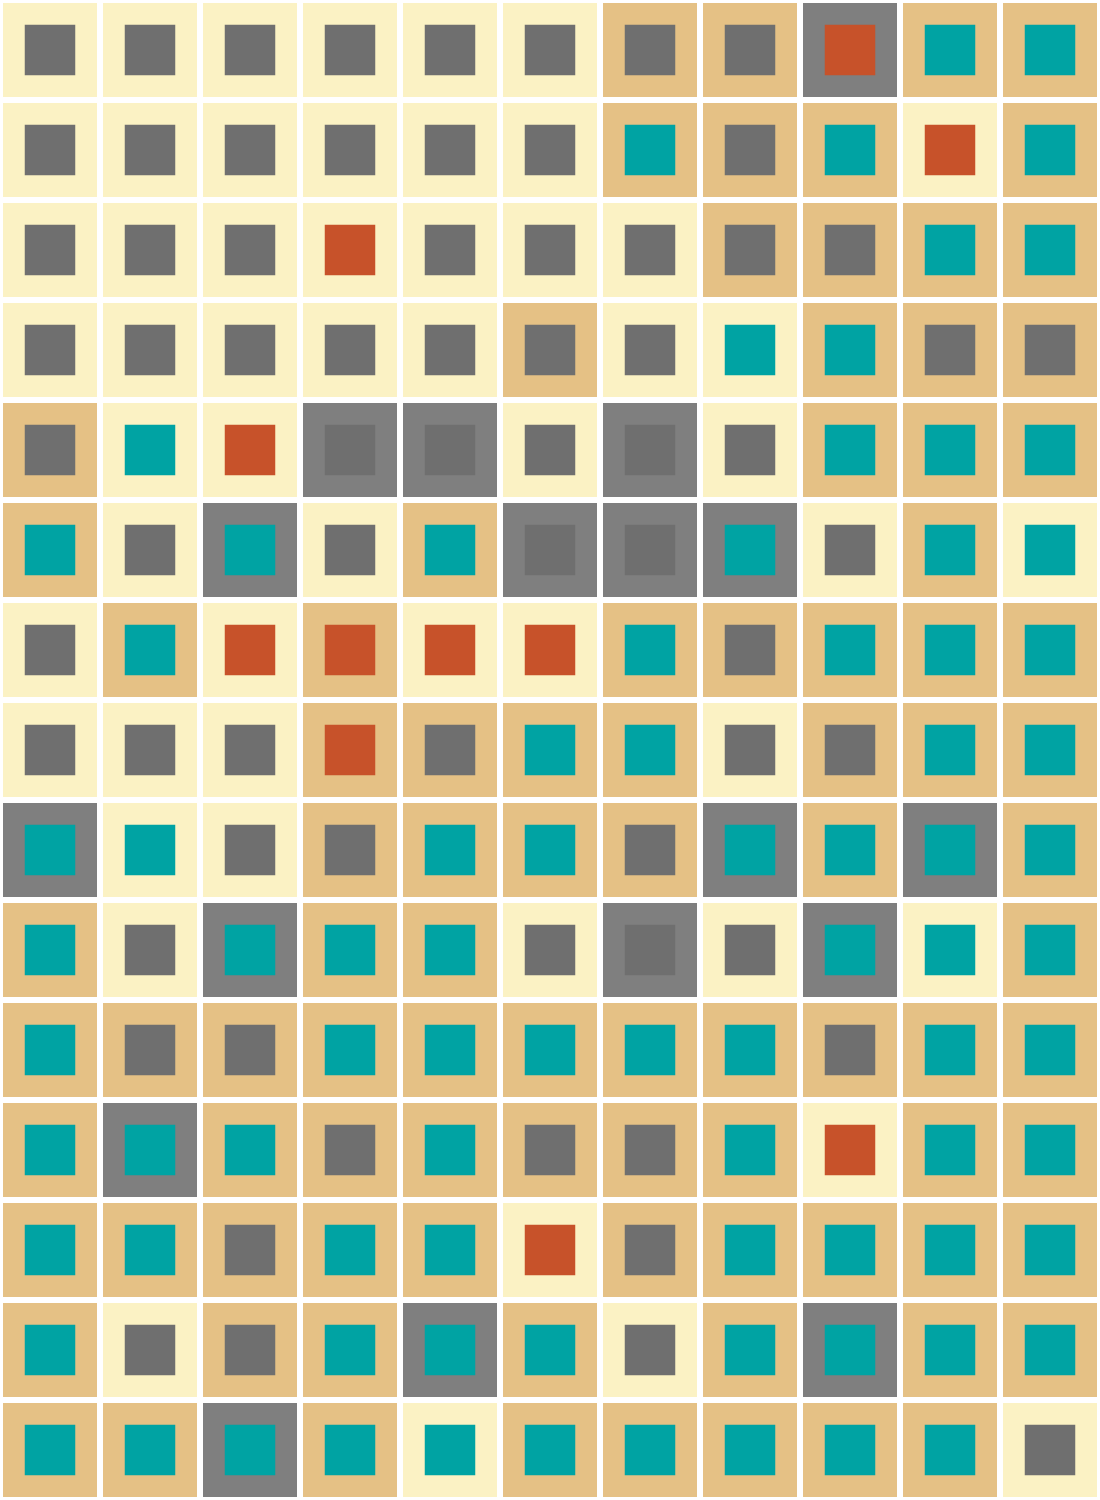
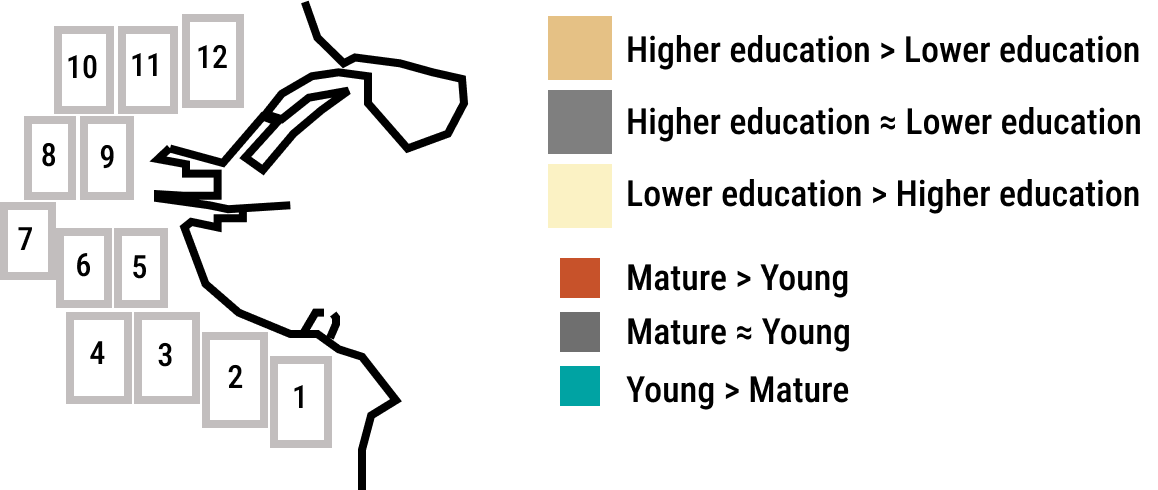
In this set of visuals two variables are represented using nested squares.
In this set of visuals two variables are represented using nested squares.