The Journey
Initial Idea
Everything started with the aim of creating an aesthetically pleasing spatial visualisation of multiple social data layers. This has usually been difficult to achieve due to the varying sizes and messy boundaries of small area statistical units. I wanted a cleaner and more abstract visual layout to better represent the small areas which are supposed to contain similar numbers of households. A more abstract form would also allow for more freedom in visual design.
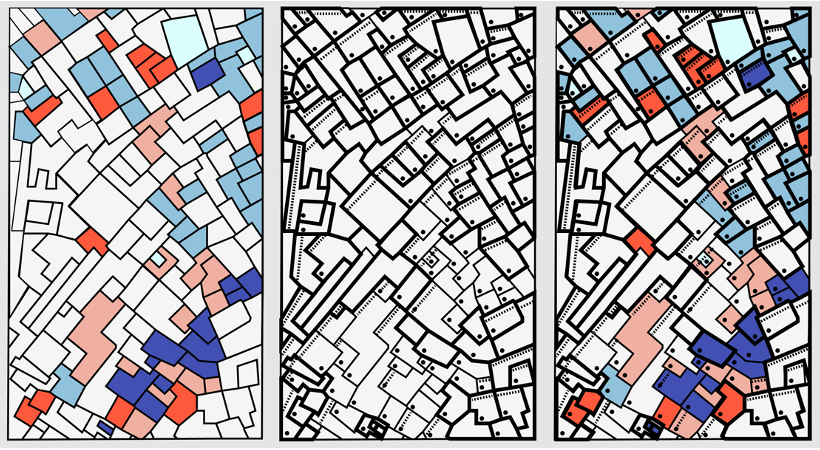
After some initial experiments with simplifying boundaries I realised I wanted to go further and have a uniform shape for each area.
I wanted to use those uniform shapes as a canvas to present data in a different artistic style. I experimented manually with translating small areas into a grid structure, maintaining spatial relationships as much as possible.
Manual Prototypes
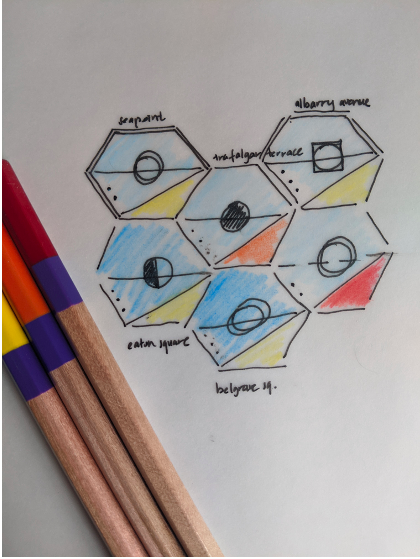
In my initial prototype, every step of this process was done manually. I choose a rectangular sample area and tried to assign each small area to a grid cell. I experimented first with pen and paper to find a visual language.
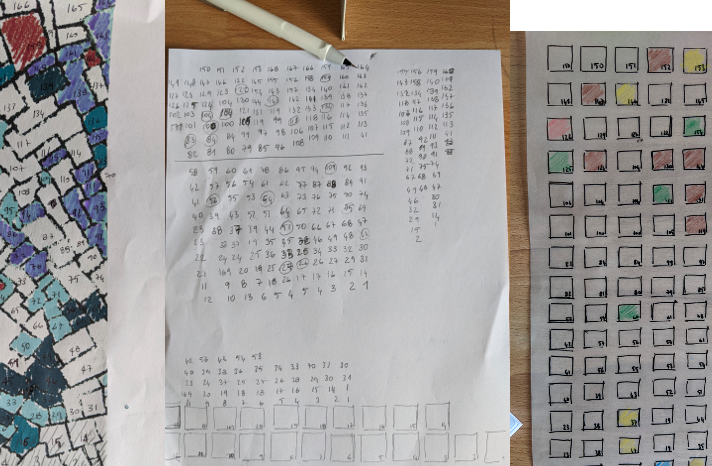
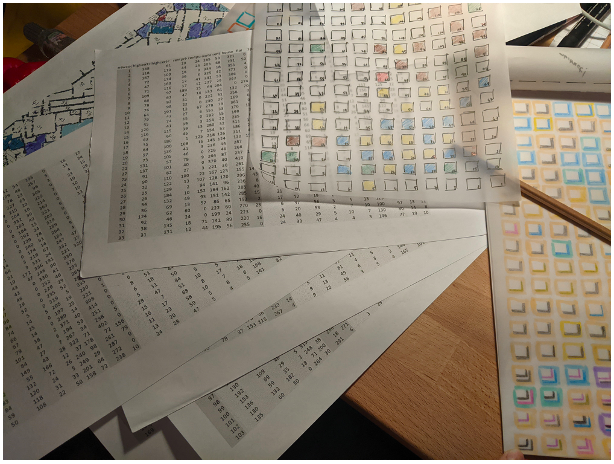
I then moved on to applying the same process for a more complex visual language digitally. I was keen to try this for other areas of Dublin to see the results but the process was painstakingly slow.
Automation
At this point John said it has to be possible to automate the translation of small areas to the grid layout so I walked him through my process and he went off to research algorithms. He discovered the Kuhn-Munkres algorithm and found it could be used to accurately automate the translation process.
After John implemented the layout translation and grid drawing techniques in code we were able to iterate much faster on visual language ideas.
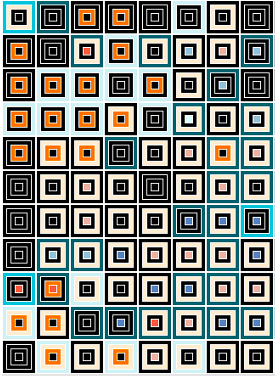
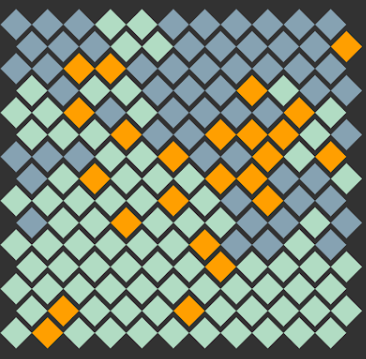
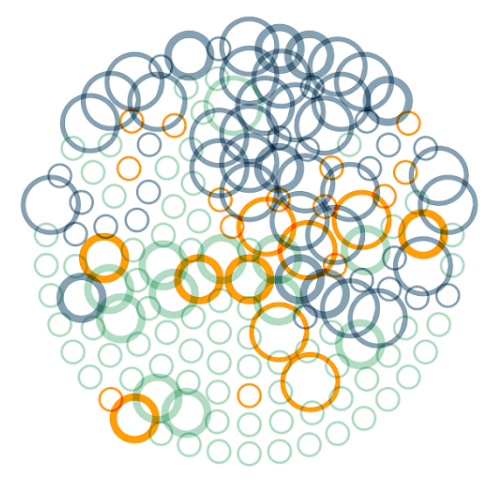
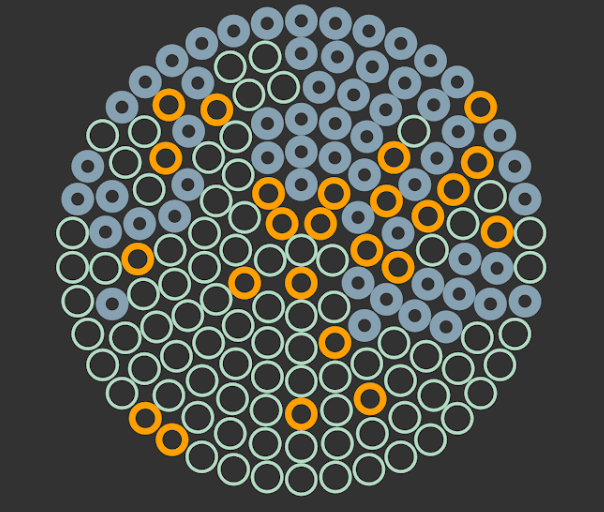
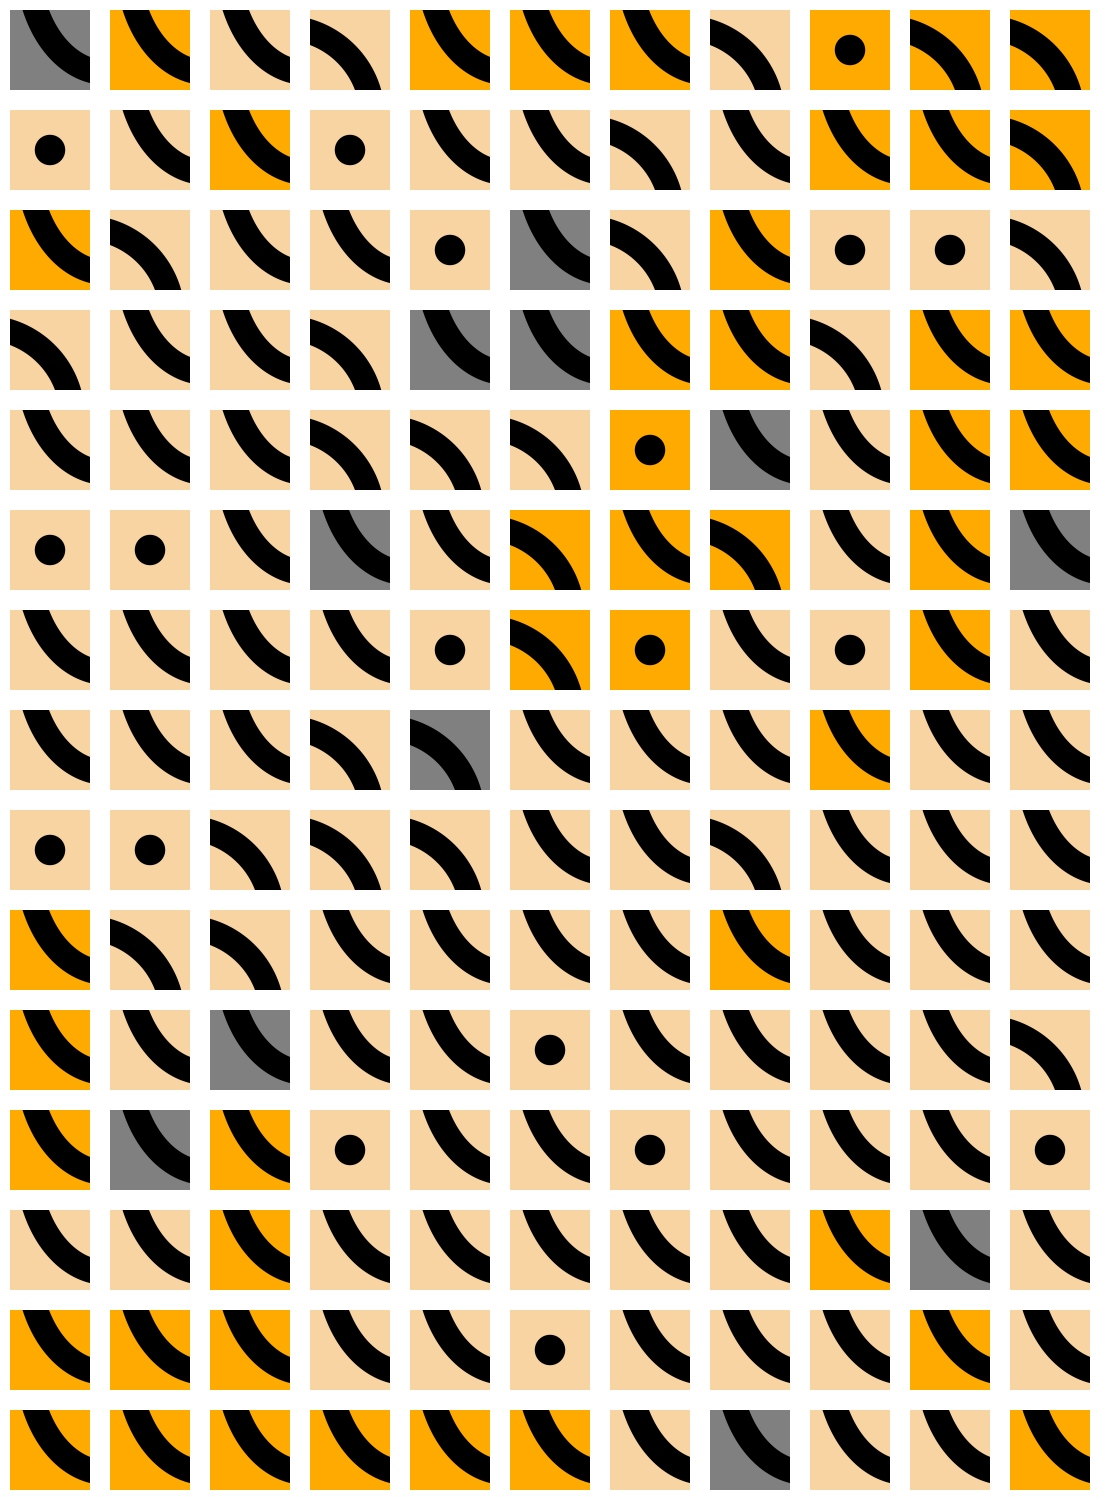
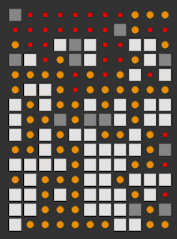
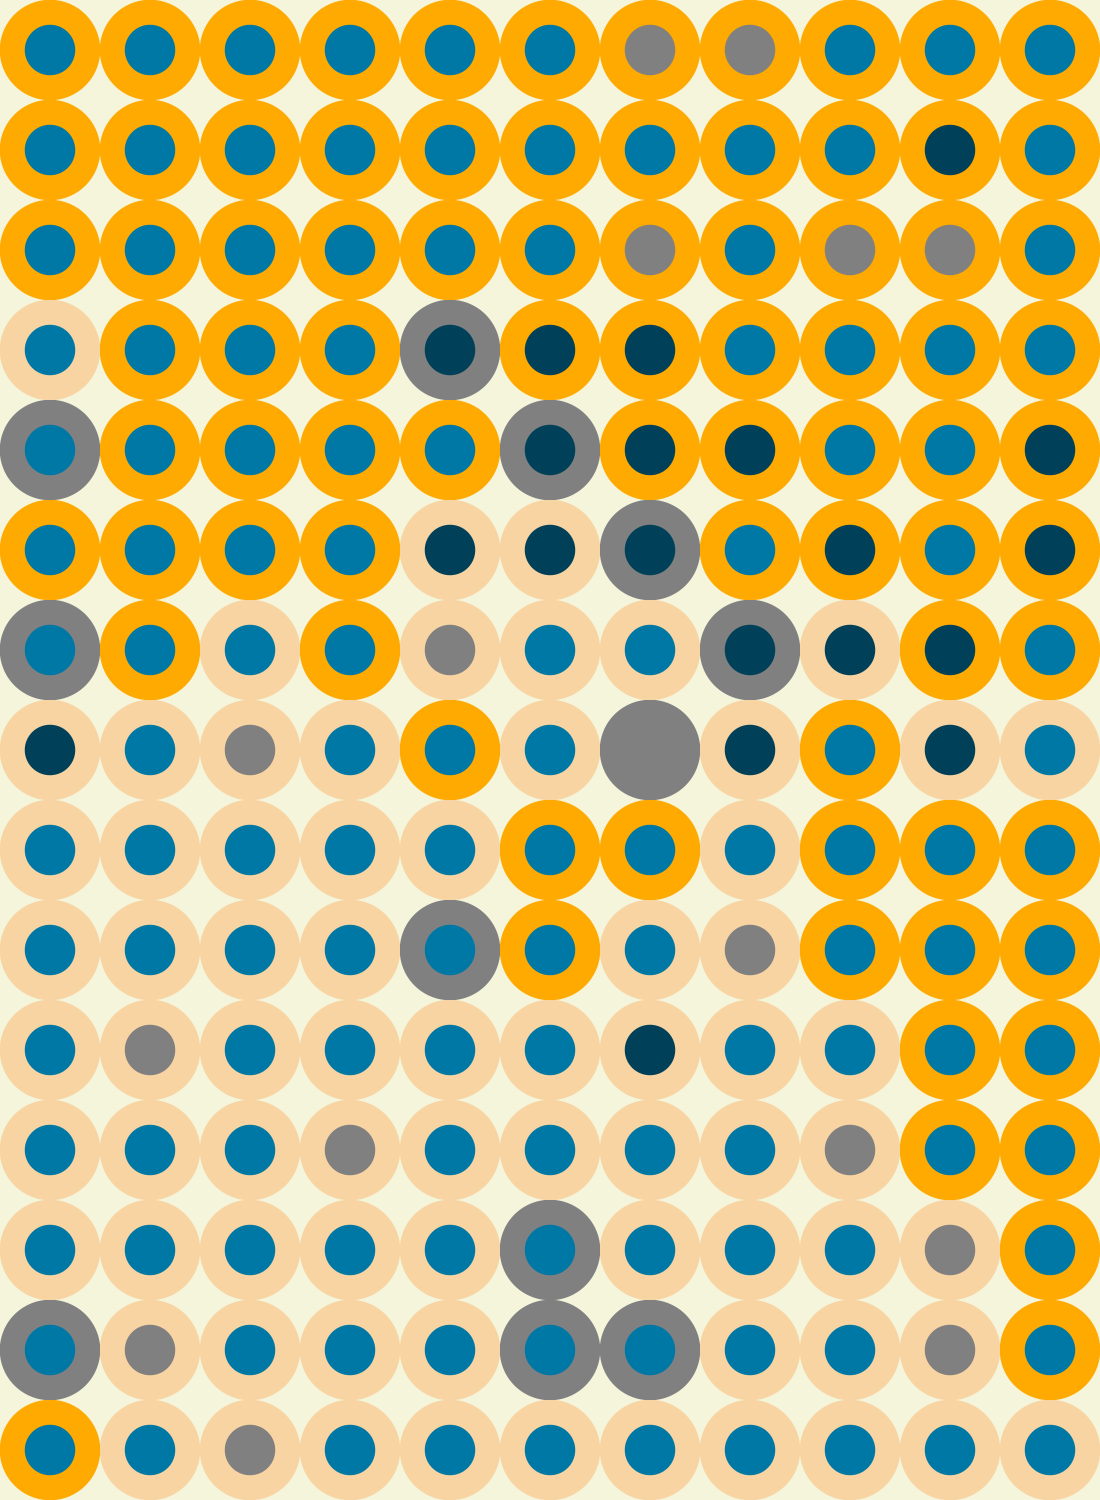
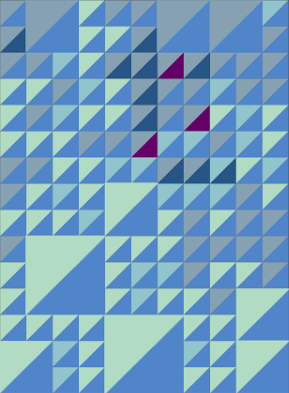
Visual Language Experiments
We had lots and lots of visual language experiments in many different directions. These experiments generated new ideas and discussion topics and also caused some sleepless nights while trying to settle on a visual language.
Future
It will be interesting to expand the scope of the project by applying this technique to other areas of the country and other datasets. It will also be exciting to see the changing patterns temporally as well as spatially.